3rd Floor, Ami-Hall, 1-1-3 Shibuya,
Shibuya-ku, Tokyo, 150-0002,
Japan



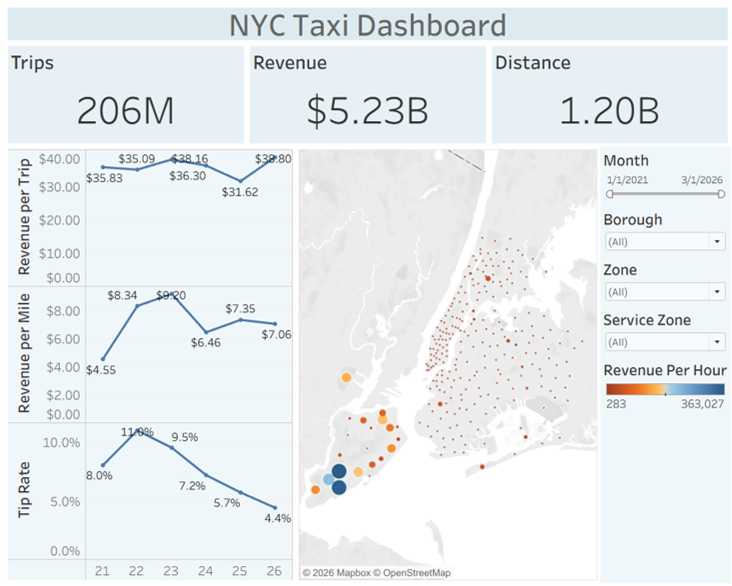
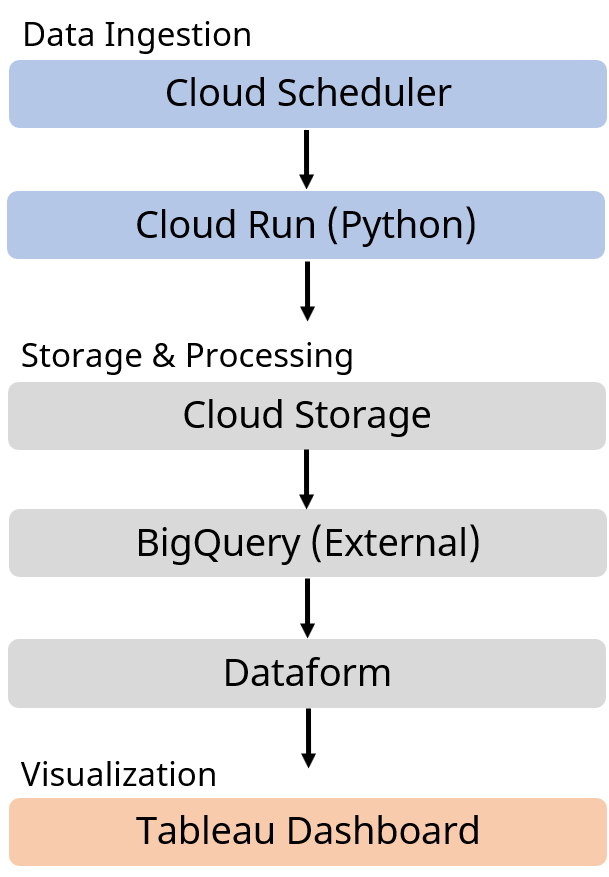
An exploration of how a fully automated data pipeline can be constructed using GCP services, connecting data ingestion, transformation, and visualization.
Demonstrated that GCP services can be orchestrated to automate the complete analytics workflow, from scheduled data ingestion to dashboard visualization.